

American ExpressData Visualisation iPad Apps
Task
Working with agency partner MMW3Degrees, Code Brewery built a suite of six iPad apps for American Express. Each one turned Amex data into graphs and charts for a particular audience, across a range of industries and regions.
Outcome
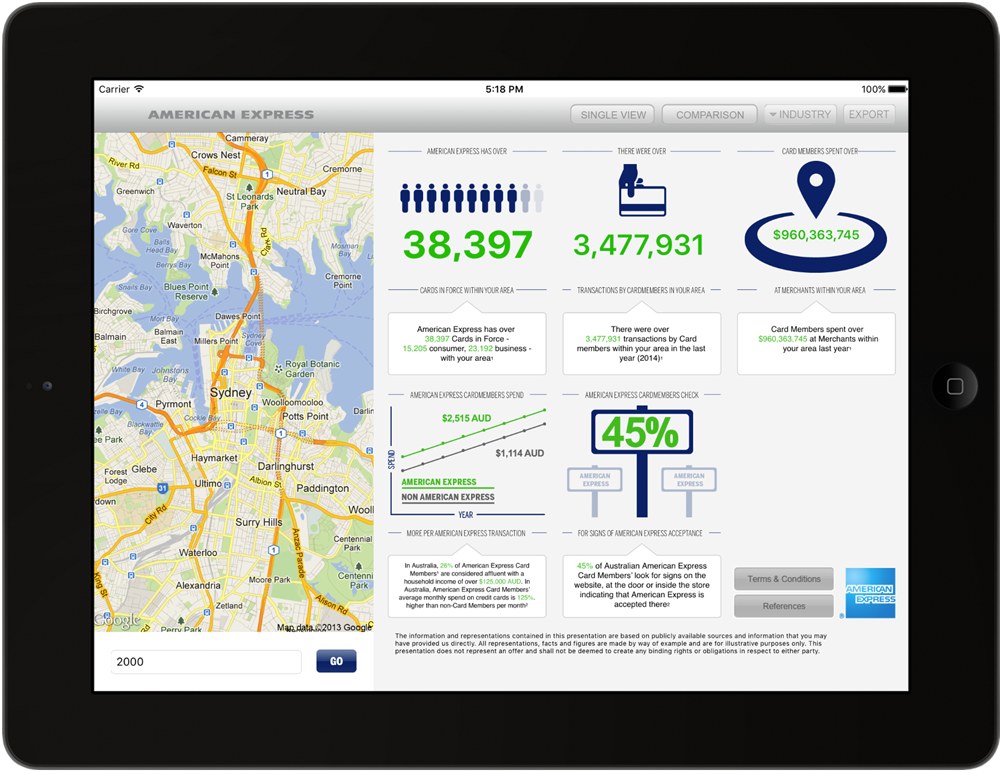
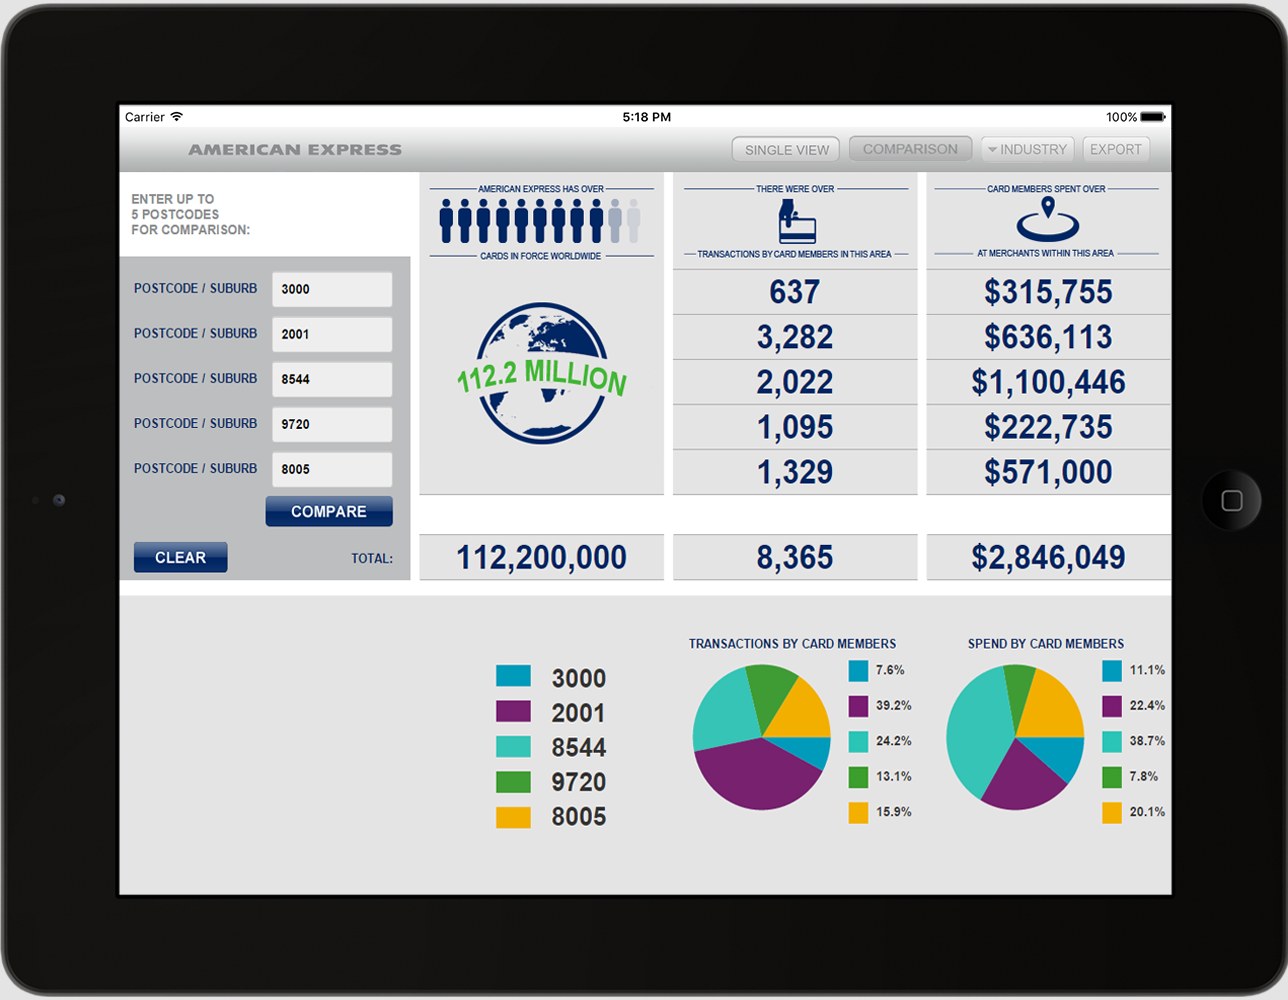
The postcode app shows what American Express looks like in a given area: how many cards are held there, how many transactions card members made, and how much they spent with local merchants. Enter one postcode for a single view on a map, or up to five to compare them side by side.
Behind the apps are custom APIs talking to a secure database, so each app draws its figures from Amex’s own data. The apps worked well enough that over the following years they were extended and released in New Zealand, Singapore and other markets across APAC.
Key features delivered:
- A single postcode view with a map and the headline figures for that area.
- Side-by-side comparison of up to five postcodes, with totals and charts of transactions and spend.
- Filtering by industry, and export of the results.
- Custom APIs linking the apps to a secure database.
 4.9
 72


